Is Simply Because They Are Not PERT Charts
They – Gantt Charts don’t show Relationships that are also known as Dependencies.
Known as Dependencies for good reason.
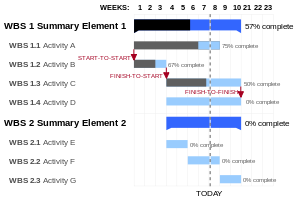
Here’s a Gantt from Wikipedia:
PERT Charts do show Relationships, that are also known as Dependencies.
Known as Dependencies for good reason.
Here’s a PERT from Wikipedia:
Dependencies
Dependencies, whether on the Critical Path or not, exist at the micro level and at the macro level.
My issue is that the macro view of Dependencies of the Gantt Chart too easily hides the micro Dependencies.
And that’s where Murphy most commonly lives. In the micro. In the details.
Murphy that devil. In the details.
Gantt Charts
From Wikipedia
A Gantt chart is a type of bar chart, developed by Henry Gantt in the 1910s, that illustrates a project schedule. Gantt charts illustrate the start and finish dates of the terminal elements and summary elements of a project. Terminal elements and summary elements comprise the work breakdown structure of the project.
The first known tool of this type was developed in 1896 by Karol Adamiecki, who called it a harmonogram. Adamiecki published his chart in 1931, however, only in Polish, which limited both its adoption and recognition of his authorship. The chart is named after Henry Gantt (1861–1919), who designed his chart around the years 1910–1915.
PERT Charts
From Wikipedia
The Program (or Project) Evaluation and Review Technique, commonly abbreviated PERT, is a statistical tool, used in project management, that is designed to analyze and represent the tasks involved in completing a given project. First developed by the United States Navy in the 1950s, it is commonly used in conjunction with the critical path method (CPM).
PERT is a method to analyze the involved tasks in completing a given project, especially the time needed to complete each task, and to identify the minimum time needed to complete the total project.
PERT was developed primarily to simplify the planning and scheduling of large and complex projects. It was developed for the U.S. Navy Special Projects Office in 1957 to support the U.S. Navy’s Polaris nuclear submarine project.[2] It was able to incorporate uncertainty by making it possible to schedule a project while not knowing precisely the details and durations of all the activities. It is more of an event-oriented technique rather than start- and completion-oriented, and is used more in projects where time is the major factor rather than cost. It is applied to very large-scale, one-time, complex, non-routine infrastructure and Research and Development projects. An example of this was for the 1968 Winter Olympics in Grenoble which applied PERT from 1965 until the opening of the 1968 Games.[3]
This project model was the first of its kind, a revival for scientific management, founded by Frederick Taylor (Taylorism) and later refined by Henry Ford(Fordism). DuPont‘s critical path method was invented at roughly the same time as PERT.
What’s It All About?
Because “it is all about” the many mini Flows in the Bigger Flows – and in those mini-Flows are PERT after PERT intermingling with more PERTs interconnected to the overall Value Chain(s) of the Enterprise.
Those macro and micro dependencies are too important to hide, they must be made to be more easily seen – and PERT does that like Gantt does not.
IMO.
Oh! Oh! You’re Saying Your Gantt is the Big Picture View of All of Your PERT Charts and Plans?
Then that’s different.
Then I might like your Gantt Chart.
But only for a second.
Let’s look at all of those Dependencies again please. A view such as the next can only be a starter view. It needs details about Dependencies too. This is at best at the macro level.
Murphy – as in Murphy’s Law, lives in the details.
There are many ways to look at the details, for “Root o’ Murphy” and they all should start with The Process itself. Is there one?
For me, I want to next understand the critical Enablers.
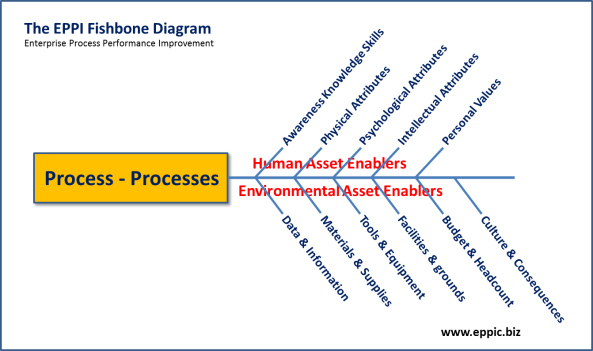
Here is my view of Enablers:
Those are the Enablers.
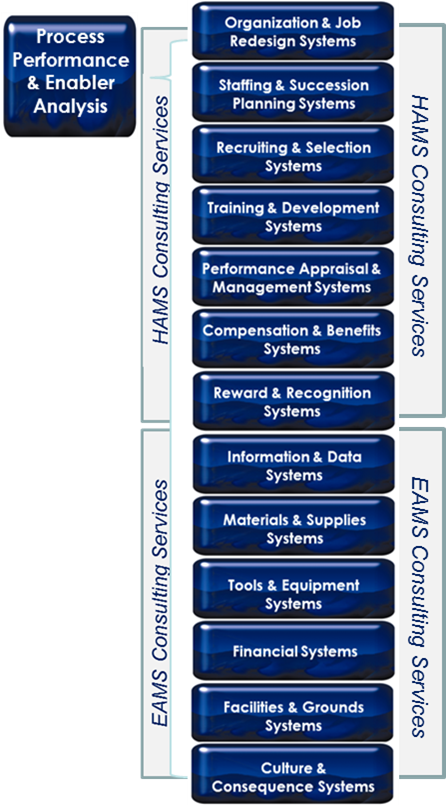
How are the “Provisioning Systems” of those Enablers being involved in the Planning and Execution of the Plan, any Plan to Improve, any Plan to Evolve, any Plan to Jump?
Here is my view of Enabler Provisioning Systems – that needs to be customized to each client and perhaps to each of their key internal businesses/divisions:
That’s the best approach.
Determine who they are – if you don’t know – and involve them in the Planning.
Get them to create in order to own the Plan.
IMO.
And the Plan is best if it is a PERT Plan.
IMO.
# # #


I transposed the regular Gantt chart, i.e. putting time axis as vertical axis. It create more compact and readable chart.
You can see some example in https://www.linkedin.com/pulse/vertical-gantt-chart-mochamad-aris-zamroni/
LikeLike
Pingback: L&D: No Plan Is a Plan | EPPIC - Pursuing Performance