
While each type of the 4 types of analysis in the PACT Processes is important, the single key to PACT Process success is performance analysis as documented through the Performance Model.
Performance Modeling pins down the requirements of the performers within the scope of the intended project and creates Performance Models.
The Performance Model is the device used to capture ideal performance requirements, and it provides a way to identify gaps from ideal performance.

I prefer generating my Performance Model charts on a double-wide flip-chart easel…but I can use two normal flip chart easels side-by-side if need be.
The Performance Model chart captures one or more “Output-Task Clusters” – clusters of data that is. Data for review and for downstream design and then development/acquisition. Data for the Levels 2-3-4 evaluations.
The information in the left half of a Performance Model describes ideal performance.
This information includes
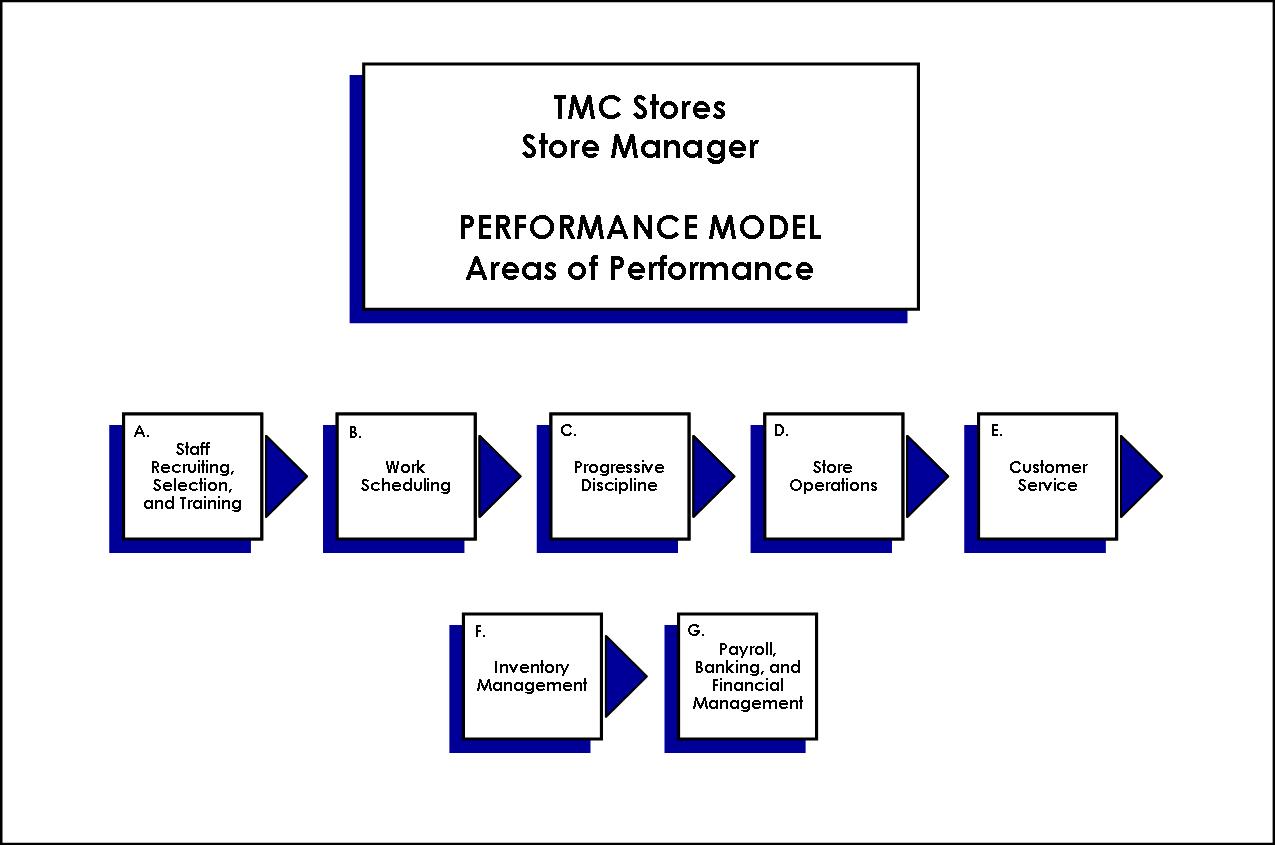
– Area of Performance (AoP, also called a segment of performance)
– Outputs produced and their measures
– Tasks performed
– Roles and responsibilities for task performance
– Measures and standards of performance (at the level of Area of Performance, output, or task)
The Output is typically a physical/kick-able kind of thing. A report. A drawing. A script. A Design Document plus the Project Steering Team Gate Review Meeting Presentation. An idea…that can be written down and then kicked around….
I often think of it as what’s there once the dust has settled. The dust raised by task performance. But BEFORE we jump into task performance…let’s understand the Output a little more.
Every Output has stakeholders who do care or who do not care about the “output itself” and/or the “process used” to produce it, or deliver it, etc…and they set the requirements, which we reflect on the PM chart as Measures…with standards if known/official.
Often those Measures boil down to quality, quantity, time and cost types. I often start with: ACT – Accurate Complete and Timely – as thought starters until my Analysis Team of Master Performers can take over and be more specific. It’s important for me to get them to take over in that fashion ASAP. For the good of the data and the good downstream.
Outputs are framed in AoPs which are framed in Processes which are framed in Systems which are framed in the owning Departments which are framed in their Functions which are framed in their Business Units which are framed in their Enterprises which are framed in their Industries which are framed in their Marketplaces which are framed in their Countries of operations and transactions…which exists within the greater Society. At least in my model.

Then linked to the Output are the Tasks. What I didn’t like about the “random lists of tasks” that I saw as a result of most people’s Task Analyses back in the late 1970s and early 1980s I resolved with this framework which puts TASKS within their proper context…related to an output within some Process. Random lists are hard to assess for their completeness as well as their accuracy if at all sorts of different levels of detail/complexity.

The information in the right half of a Performance Model also captures and articulates real performance via a gap analysis, including:
– Typical performance gaps (where standards for measures at any level are typically not being met by job incumbents)
– Probable causes of those gaps
– Differentiation of those causes into one or more of three categories of deficiency
— dE: deficiency of environmental support
— dK: deficiency of knowledge and skills
— dI: deficiency of individual attributes and values
Typical Deficiencies are related back to a Measure of an Output. And should be typical and not be “atypical” in their frequency. Notice the green line from the 1st measure to the Typ Def column in the lead photo of the flip chart page? I know that this person was trained by me. I taught hundreds of PACT Performance Analysts (PPA) in my staffs at two consulting firms and for my clients. And they were taught to do this although not everyone thought it necessary. I did. And do.
And that’s how we lead the Analysis Team into thinking about “what, if anything, always is a challenge, an issue, a performance competence deficit for many?” when the time comes to introduce this portion of the analysis – data capture of the gaps. They need help recalibrating to the change I’m putting them through…now looking for new data when I finally get to that column of the charts – AFTER having completed the left-side of the charts – BEFORE beginning this new data collection, critique, collaborative consensus effort of where non-Master Performers struggle.
And since they ARE Master Performers and therefore are by definition very sharp, especially when it’s THEIR JOB that we’re looking at…they are even sharper…they will soon “get it” regarding what I am looking for now. They only need an example and non-example or two. And a line drawn on the chart in a different color from the frame color and the words color. Keeping it visually better organized by using colors in a not-random manner.
It’s sometimes silly things like that that hinder a groups’ conceptual grasp of what you are trying to accomplish…using your alien approach…alien to them perhaps. My need to break their jobs down for Instructional Design purposes is most likely different from perhaps how they each look at their jobs overall. My experience suggests that most performers do not share a common view of their work or workflows. If they have one at all.
But Master Performers typically do. And in any group of 6 or more there will be 7 or more mental models. All understood by their owners at different levels of detail. Doing a group-mind-meld is the task here for the analyst…Analysis Team facilitator.
Back to keeping it visual.
That’s how you get more relevant data. By being visually different in the midst of the “sea of words” that you’ll be capturing on perhaps dozens of charts before you are done. Mark up your chart. Link this column to that – to systematically derive the next set of data. Data that you WILL USE in your downstream efforts. Not just data captured that is interesting at best but not a building block towards Instructional Design outputs…deliverables.

Probable Gap is a pair of “weasel-words” to avoid getting caught up in “Root Cause Analysis” which would take much longer than what I intend for what I need downstream.
I’m always using a set amount of time to conduct these group meetings and can’t take on probing all issues (big and small) to come down to substantiated root causes…I’m looking for what the Master Performers think off the tops of their heads…and see if they come to a consensus or not. And to what degree…they readily agree…or not.
Probable Gap Causes uses three categories of deficiencies – of:
- Environment,
- Knowledge and Skills, and
- Individual Attributes and Values
…and are intended to describe the probable barriers to superior performance…not to indict the performers. These are deficiencies of environmental supports (dE), of knowledge and skills (dK), and of individual attributes and values (dI).
Deficiency of Environmental Supports – dE
Environmental supports may be deficient and impede high performance. T&D cannot solve such deficiencies. T&D can only give the learner a heads-up that these are part of the imperfect world that they’ll have to learn to deal with to be successful.
The dEs can include problems related to the following:
– Facilities
– Materials
– Methods and procedures
– Financial resources
– Consequence system
– Information and data
– Feedback
– Workload/timing
Deficiency of Knowledge and Skills – dK
Knowledge and skills of incumbent performers may be deficient, causing them to have difficulty performing the tasks required to produce the desired outputs at the appropriate quality standards. T&D can usually solve these deficiencies unless a dI also exists.
Deficiency of Individual Attributes and Values – dI
T&D cannot solve deficiencies involving individual attributes and values; only a change in the selection and/or incentive systems can possibly affect these issues. (Appropriate T&D might be targeted at the managers or others responsible for recruiting, selecting, and hiring the target audience.)
The dIs can be caused by deficiencies in one or more of the individuals’ attributes and values, including the following:
– Intellectual attributes
– Physical attributes
– Psychological attributes and values
Summary
Looking at Performance Competence in this manner, using AoPs and Performance Model charts – will allow you to systematically derive the enablers, including the Knowledge and Skills required…which can then be generalized down into Competencies – if your culture doesn’t tolerate the real details.
And then at least you’ll have real links back to real performance data to help you try to better affect performance improvement efforts via Information & Instruction – targeted at specific workflows/processes. And have a more meaningful foundation under the simplified view of real-world complexity that Competency Models often are reduced to.
I’ve been asked by clients to help them “back” their Competency Models back into performance-based Instruction. It cannot easily – or cheaply – be done. It is like using “categories of construction materials” as the materials to build a real house. It generates generic content on the topic itself or a general skill – and not on performance-based content: information and instruction on real-world performance applications.
And therefore while the Level 1 evaluations may look good…and even the Level 2 evaluations if measured…but nothing gets “moved out” into the varied performance contexts of the learners to affect Levels 3 and 4 in a positive manner…only in a negative manner…if measured. At least that is what the research suggests…that learning something “outside of your real performance context” and being expected to make that transfer well yourself later…only is feasible/possible for the very few. Not for the many.
For experienced assistance with this performance-based vs. competency-based approach to ISD and HPT – please contact me:
Guy W Wallace
Certified Performance Technologist
President, EPPIC Inc.
office: 704- 895- 6364
mobile: 704- 746- 5126
guy.wallace@eppic.biz
http://www.eppic.biz/
I offer formal 3-5 day Workshops and less-formal 1-3 day Coaching Sessions for PACT Performance Analysts – teaching them “how to conduct the PACT Analysis methods using groups of Master Performers” – and have taught hundreds of practitioners via these formal and informal means since the mid-1980s.
For Workshop participant testimonials: http://www.eppic.biz/mainframe/testimonials.htm#Workshops
See more about this and other topics and offerings go to: http://www.eppic.biz/
# # #
