
ESIRA – Like RACI* – but clearer sometimes.
A Twitter tweet exchange with Dennis Callahan earlier this week inspired me to revisit the methods and devices I have used in the past, and trained others to do, to help groups of Master Performers model “ideal performance” – against which you can later conduct a “gap analysis” of actual “typical” (and on rare occasion: and/or atypical) performance of the incumbent population. More on that Gap Analysis later.
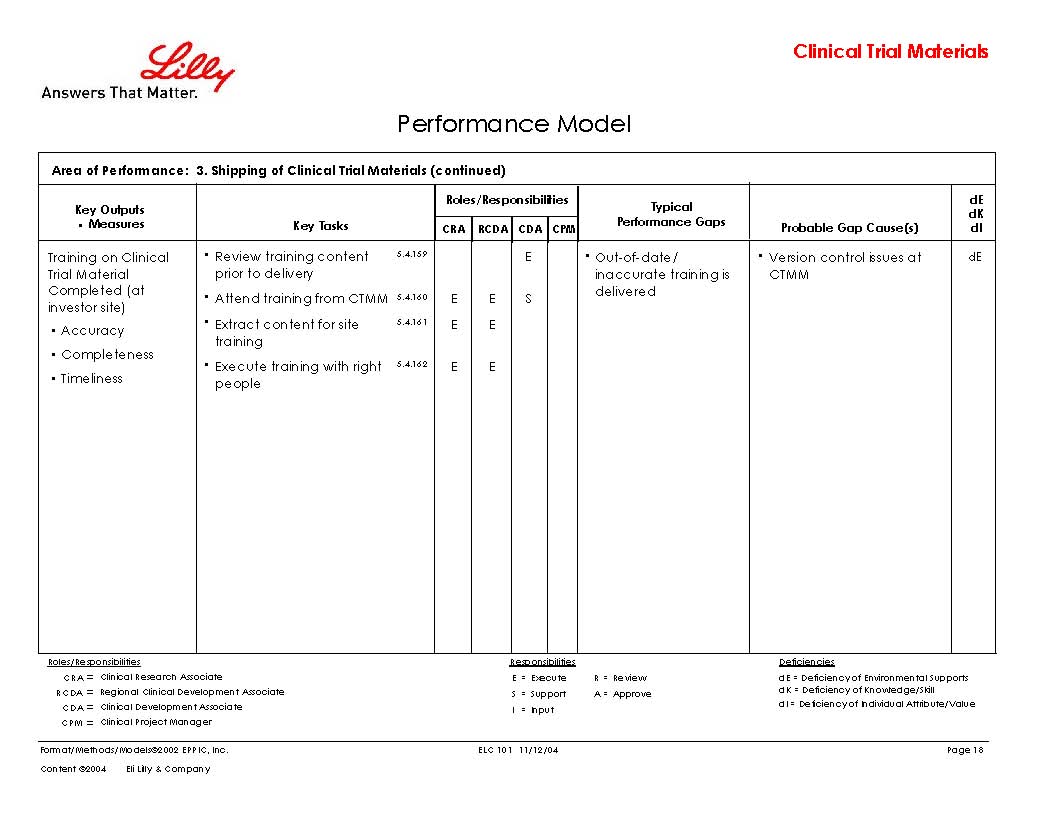
A big part of for me in getting Role Clarity is sometimes, but not always, but especially in complex Performance Contexts, is the use of Role/Responsibility “columns” on a Performance Model chart (see the graphic below – click on it to enlarge and scan it top to bottom for the data it presents and the codes used in the center, defined in the footer of the PM chart).
The clarity comes from using some device like this to define who’s doing what, when, etc., where there are “co-performers” in a task-set statement. When there are multiple players in the sand box of performance – however framed, to whatever scale.
See those task statements above? Sometimes they are Micro-Task granular – and sometimes they are more “Macro-Tasks” big – Macro with many micro-tasks (you might call them steps or something else) where that level of detail doesn’t make it to the page (the PM chart). The more global (vs. granular) that they are the more you need further clarification regarding each “role’s” responsibility within that one task statement.
It’s the old “Who’s on First?” for your effort later if you don’t clarify this better early – and only to the level of detail, etc, necessary and adequate to YOUR DOWNSTREAM needs.
So it can and will vary.
So – in those R/R “columns” above, you see the various letters, and the codes at the bottom of the Performance Model Chart.
BTW – I’ve always pronounced it/the system I inherited from former business partner Ray Svenson back in 1982: “iss-ih-rah” – but you do as you please.

So the example chart 2 above, enables a group of Master Performers (who else would you ask?) to be facilitated to clarify “ideally” who does what, etc. Tying Tasks to Outputs, and organizing them by Areas of Performance (AoPs – a decidedly task versus topic orientation) for complex Performance Contexts – such as the context for graphic #1 above – where that focus on “training” is one small slice of the “Performance Context” of Clinical Trials Management – globally.
That one page (Performance Model chart) is one of over 50 to describe the “ideal performance” and to capture the “gap analysis against that ideal” as determined by the facilitated Master Performers – and others as needed/appropriate to the downstream uses of this data-set). This was part of an effort to follow-on a Six Sigma project that re-engineered this global corporate (high risk and high reward) process – with my PACT methodologies for CAD – Curriculum Architecture Design. The effort produced a T&D Path (or Learning Path) of a modular curriculum where many sets of content (performance-based information and instruction) were logically set in a framework and sequence – on the visible T&D Path (itself a Marketing Poster if you will).
Partial – Defining Role Clarity Another Way – And Why
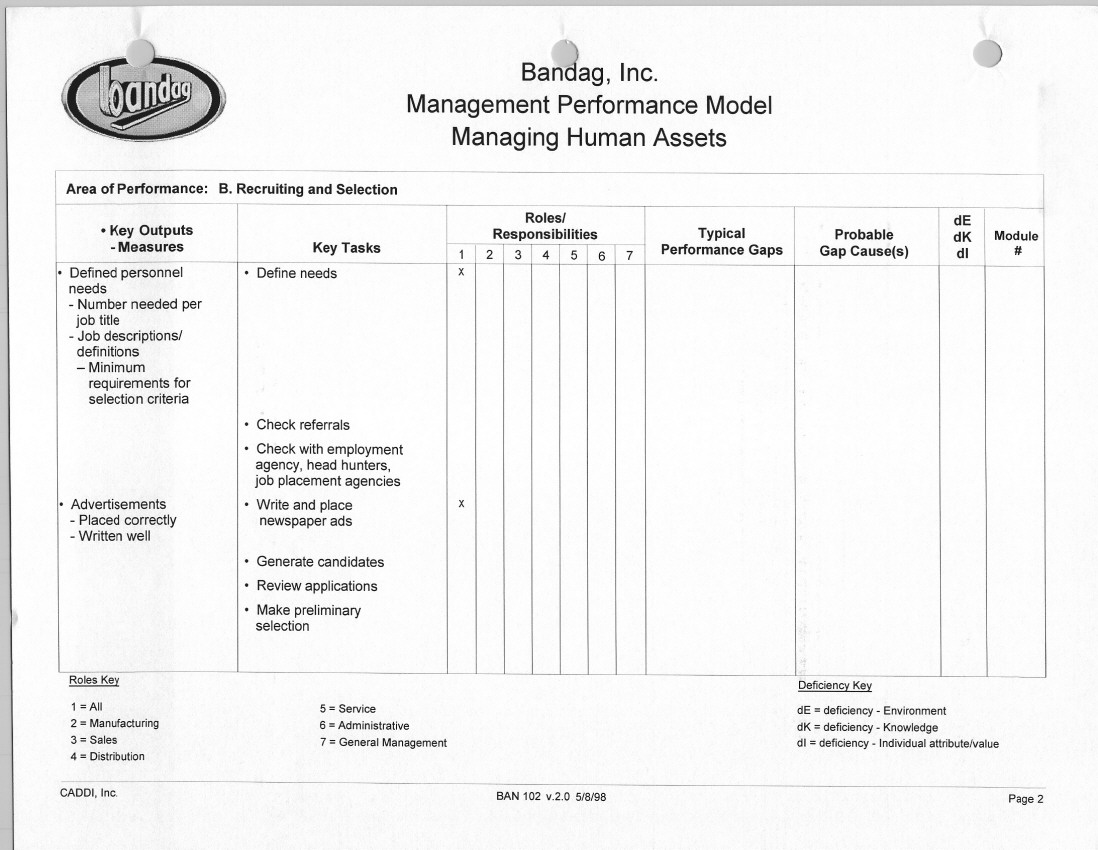
The example PM chart below uses a different “role clarity device” – a different “code” to further define who might be doing such-and-such a task-set. P is for Primary as in, this Role (job title, etc.) is responsible for this task (task-set) most of the time. The X means that these Roles are sometimes “on the hook” to conduct this.

Can you see the cross training needs pop out in front of your very eyes? I do as I facilitate groups. I also immediately see the potential need for a “train ’em” either both: before the need and during the need – or just during the need. For the X group that sometimes has to do this. Again, the potential for that. But that is on my radar screen – something to be addressed in the Design phase of PACT, not now during the Analysis phase.
Not Used – Not Specifically Defining Role Responsibility Differences
Is it always necessary to use the R/R column and Responsibility Code Definitions devices on the PM chart?
No.
As always it depends. The example below did not. Check it out.
What’s the deal? Why not used in this project, with its own “Context” in the Client’s project? And who decides, and when? The short answer is: the needs you have downstream – which you should understand. You should almost always collect “only the data and to the detail required” for your known needs downstream in “your process.”
The long answer is too long for here in this post.
Other Responsibility Code Definitions
*RACI – a very popular device, a set of definitions. Many groups that I worked with over the past 3 decades sometimes struggled themselves with the real difference with the R and the A – as defined/used in their own organizations.
BTW- I very much like the RACI definitions below – they are much clearer than the official definitions that some of my clients used internally – and sometimes caused the hangups – which were always more visible to me during the group process than to perhaps most of the participating Master Performers. And in my PACT Processes, not having a group consensus in any one step leads to the unwinding of group confidence in the quality, quantity and appropriateness of the data that we as a group generate.
Hmm. Worrisome. How to avoid?
Use what works. These Responsibility Code-sets are just one piece of doing this.
RACI
Definitions from: http://en.wikipedia.org/wiki/Responsibility_assignment_matrix
Responsible
Those who do the work to achieve the task. There is typically one role with a participation type of Responsible, although others can be delegated to assist in the work required.
Accountable (also Approver or final Approving authority)
Those who are ultimately accountable for the correct and thorough completion of the deliverable or task, and the one to whom Responsible is accountable. In other words, an Accountable must sign off (Approve) on work that Responsible provides. There must be only one Accountable specified for each task or deliverable.
Consulted
Those whose opinions are sought; and with whom there is two-way communication.
Informed
Those who are kept up-to-date on progress, often only on completion of the task or deliverable; and with whom there is just one-way communication.
If my team of Master Performers (think of a group of very strong egos in one room) were really struggling with this – I would often propose a switch. If they then, as a group of Master Performers decided it was OK for us to use ESIRA instead of RACI, when their organizations typically used that definition-set, we would.
It then always seemed to be OK with everyone who later saw the Performance Model charts – typed up from the original flip chart pages we used in the group process method I prefer to generate such data.
But RACI is a good tool too. I just started using ESIRA in the early 1980s and I didn’t come across RACI until later in that decade or early in the next. Again, you use what works. And you flex as much as needed – as determined by your downstream needs and methods.
Adopt if you can and it’s appropriate – otherwise adapt as needed. Avoid starting from scratch. Do a little home work first. Ala ~ Abe Lincoln:
“Give me six hours to chop down a tree and I will spend the first four sharpening the axe.”
The Gap Analysis and the R/R
The data captured on the PM charts links the roles and their responsibilities data AND the gap data – back to an output – hopefully a Worthy Output – within the framework of AoPs: Areas of Performance.
In the group process, after all of the ideal PM data is captured (the left side of the PM chart) the Gap data is systematically derived by the facilitated group of Master Performers – again – who else would you ask about the Master Performers’ peers who were not Masters – but doing the job at levels less than masterly?

Finally
And if one is modeling a future state versus a current state – it is trickier – it just requires more heads in the facilitated process.
Other Resources
This Blog – has many posts on PM charts and the process for generating the data. There is an ISPI article in PIJ in 2004 (which was back when ISPI was NSPI). There is also my Chapter 11 in the 3rd Edition of the Handbook of Human Performance Technology: order here. And there are several relevant Slideshare Presentations and Articles (Documents): here.
# # #

Pingback: T&D: Role & Hierarchy Clarity Is a Good Thing | EPPIC - Pursuing Performance
As always, nice thorough post. I like the flexibility of a few different models that can be used based on the situation (like the example you provided). I'm going to give ERISA a try and will let you know. Thanks, Dennis
LikeLike