What Enables a Process?
The intent of this post is to share an overview my proven approach for quickly developing a consensus model of mastery performance, at the individual level, at the process level, and at the organizational level, using data-sets.
Which you can adopt and/or adapt.
And then to also quickly, overview how to systematically derive the human and environmental “enablers” required to support that mastery performance.
That effort then enables the assessment of all gaps, the costs to address versus the costs to ignore and the ROI, by understanding them all, as parts of a system, to judge their importance and adequacy for the current state, the future state, or both. What to do about those gaps. In performance.
Performance Data
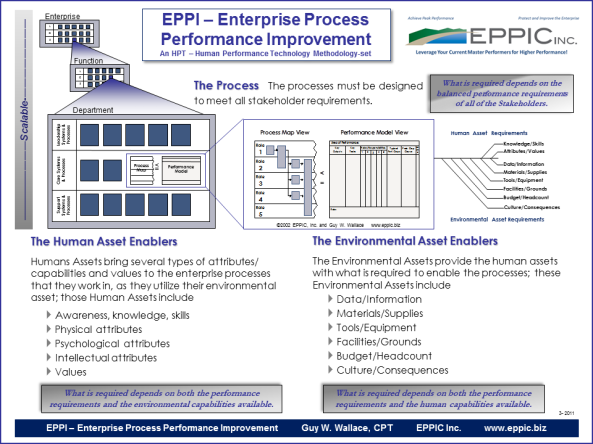
That data will then allow one to determine which of the enabler gaps might warrant closing, based on the performance improvement initiatives’ ROI projections. But first, the big picture in this next graphic. Refer back to this later. Click on to enlarge and/or copy.
This analysis approach is best used where some of the performers are already demonstrating high performance, and others are not. I have used this evolving approach in over 200 projects for my Fortune 500 clients since 1982 for instructional and non-instructional efforts. I have trained and coached over 250 practitioners in their application. Together we would have well over 500 applications stories to tell. And if truth be told, one might discern much variability in the exactness of the approaches used in both Modeling Mastery Performance and Systematically Deriving the Enablers by those many practitioners.
It’s a robust approach, because it is more about the data-sets and less about the exactness of the process approach or method; although some process approaches/methods are indeed quicker than others. We will cover both the accelerated and other approach to Modeling Mastery Performance, and then Systematically Deriving the Enablers.
INTRODUCTION TO THE KEY DATA-SETS
The two key data-sets are Performance Models and Enabler Matrices. They respectively capture the model of mastery performance, and the enablers of that mastery.
The Performance Model and the Enabler Matrices are two, linked set of data that are produced for the current state view by current Master Performers, who have proven that high performance levels are attainable. The Performance Model and the Enabler Matrices can also be produced for a future state view.
Performance Models
The Performance Modeling effort documents the requirements of the performers within the scope of the intended project and creates Performance Models. The Performance Model is the device used to capture ideal performance requirements; and it documents identified gaps from that ideal performance and their probable causes.
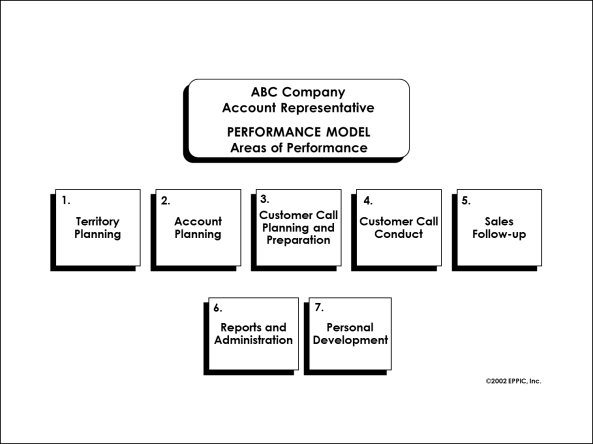
The Performance Model has two components: 1- AoPs (Areas of Performance) which are the “segments” of overall performance; and 2 – Performance Model Charts capture the data details for each AoP segment. Performance Models may be developed for an organization, a function, a job, a task, or a process.
The information in a Performance Model includes a segmentation of overall performance into “Areas of Performance/AoP” segments, plus AoP details regarding the expectations for outputs and their measures and standards, the tasks per output, and the roles and responsibilities per task, for all of the performers involved. That ideal, mastery performance is documented on the left side of the Performance Model chart. It is then used to facilitate a structured and systematic gap analysis on the right side.
The entire Performance Model data-set, with the ideal and gap analysis data, is then used in the specification and analysis of both the human enablers, and the environmental enablers that are required to enable mastery performance.
Enabler Matrices
The Enabler Matrices document the human and environmental asset enablers required for mastery performance.
Human Asset Requirements Enabler Analysis is where the requirements for the human assets are determined via a systematic review of the documented mastery performance outputs and tasks. Human assets categories are:
- Awareness, Knowledge, Skill
- Physical attributes
- Intellectual attributes
- Psychological attributes
- Personal Values
Environmental Asset Requirements Enabler Analysis is where the requirements for all non-human assets are determined, again, via a systematic review of the documented mastery performance. Environmental assets categories are:
- Data/Information
- Material/Supply
- Tools/Equipment
- Facilities/Grounds
- Headcount/Budget
- Culture/Consequences
The systematic review of the Performance Model charts’ data facilitates the systematic generation of the various enablers, by the enabler categories above and their sub-categories. For example, I use 17 sub-categories for the analysis of the “Awareness, Knowledge, Skill” category.

This captured data later facilitates additional analyses such as validation of any complex interpersonal behaviors, root-cause problem solving, or further assessment of the adequacy of various enterprise entities in the enterprise value chains that are in place to ensure that the right human and environmental asset systems are in place, at the right process place, at the right times necessary to achieve and sustain peak performance.
Other Potential Analyses Required
While it is my claim that the two sets of data in the Performance Models and Enabler Matrices are at the heart of analysis for any improvement effort, there are other analyses, such as financial, competitive, marketplace, Strengths-Weaknesses-Opportunities-Threats, legal, ethical, benchmarking, process mapping, activity based costing, and so on that may also be necessary at times. At other times, they may not be necessary at all.
The purpose of the analysis efforts of Performance Modeling and Enabler Analysis are to generate data and insights regarding performance improvement potential and to assist in identifying the probable improvement levers. Then improvement initiatives can be better planned, cost estimated, and the return on investment reasonably forecasted.
Three Performance Variables That Might Need Changing
Improvement efforts in this approach look at the following three major components of performance to leverage improvement:
- The Process itself
- The enabling Human Assets
- The enabling Environmental Assets
The understanding of the ideal and actual for these three is crucial, as it is one, two, or all three of these variables which may be in need of an improvement effort to leverage overall performance. Those improvement levers are determined after the analysis has been completed and ROI has been calculated for various improvement scenarios.
It may be that the process and human assets are fine, but that ¾ of the performers lack one of the proper environmental asset. Think of ¾ of the lumber jacks and jills with dull saw blades due to a budget constraint.
Process Design/Redesign
Process design/redesign is targeted at improving error reduction, cycle time reduction, and cost reduction. Better, faster and cheaper. Tools and techniques used in process design/redesign include: process mapping, value stream mapping, statistical process control, process simplification, process automation, activity based costing, and so on.
Not all of the enterprise’s systems/processes have to always be in tight, statistical process control to produce the required outputs/deliverables necessary to achieve peak performance. But some do.
Control won’t make up for a bad business plan or reconcile with other conflicting goals within the enterprise. But it is still a critical component to pulling off the business plan. The stakes are high for the high-impact processes. Failure of core business processes is usually not a viable option, for it can result in the overall death of the enterprise.
The Performance Model provides an illustration of both ideal process performance and actual process performance via its gap analysis, and can provide the basis for the targeting of improvement resources for various improvement interventions, including design/redesign of the process itself.
Either the process is designed to meet its current or future metrics, or it needs to be redesigned to do so. This is always the starting point…the process itself.
Human Asset Management Systems Changes
The Human Asset Management Systems (HAMS) provide the right human assets to the right processes at the right time and in the right quantity to enable the enterprise process to operate at peak performance, as already demonstrated by the Master Performers.
Those HAMS are typically owned (or shared) with the Human Resources function, and include:
- Jobs/Organization Design systems
- Staffing/Succession Planning systems
- Recruiting/Selection systems
- Training/Development systems
- Appraisal/Performance Management systems
- Compensation/Benefit systems
- Rewards/Recognition systems
These Human Asset Management systems must be aligned or re-aligned with the requirements of the enterprise processes, and produce worthy outputs, as judged by the downstream customer and other process stakeholders. They are in place within the enterprise to ensure the following human assets are in place:
- Awareness, Knowledge, Skill
- Physical attributes
- Intellectual attributes
- Psychological attributes
- Personal Values
Not all of the HAMS’ processes have to always be in tight, statistical process control to produce the required outputs/deliverables necessary to achieve peak performance. But some do. It is always situational.
Environmental Asset Management Systems Changes
The Environmental Asset Management System (EAMS) should provide the right non-human, environmental assets, to the right processes at the right time and in the right quantity to enable the enterprise process to operate at peak performance, as already achieved by the Master Performers. If they do not, they will need to be improved. The EAMS include:
- Data/Information systems
- Material/Supply systems
- Tools/Equipment systems
- Facilities/Ground systems
- Headcount/Budget systems
- Culture/Consequence systems
The EAMS ensure that the processes and the humans performing in those processes have the right:
- Data/Information
- Materials/Supplies
- Tools/Equipment
- Facilities/Grounds
- Headcount/Budget
- Culture/Consequences
Ownership of the EAMS various to a much greater extent, than for the HAMS. Just the ownership for various types of data outputs as process inputs further downstream is voluminous and therefore difficult to ascertain with 100% certainty. Not all of the EAMS’ processes have to always be in tight, statistical process control to produce the required outputs/deliverables necessary to achieve peak performance.
The situation will dictate what is necessary.
So, as always, it depends.
Be flexible.
Adapt as Needed.
# # #


Pingback: Wk 1 Discussion 515 – My Blog
Pingback: Wk 1 Discussion 515 - The Best Essay Writers
Pingback: Wk 1 Discussion 515 - studyhope.com
Pingback: Wk 1 Discussion 515 - Buy Cheap Essay
Pingback: Wk 1 Discussion 515 - Nursing Homework
Pingback: Wk 1 Discussion 515 | BestAcademicPapers
Pingback: Wk 1 Discussion 515 | StudyDaddy.com | Nerd Essay Writers
Pingback: Wk 1 Discussion 515 - Lliterature Homework Help
Pingback: Wk 1 Discussion 515 | StudyDaddy.com | Assignment Mall
Pingback: SupremeAuthors
Pingback: Wk 1 Discussion 515 | Blueribbonwriters.com
Pingback: Wk 1 Discussion 515 - Top University Tutor
Pingback: Wk 1 Discussion 515 - studywriters
Pingback: Wk 1 Discussion 515 – DATA POPES
Pingback: Wk 1 Discussion 515 - Lion Essays
Pingback: Wk 1 Discussion 515 - Global Nursing Essays
Pingback: Wk 1 Discussion 515 - Collegepapersworld.com
Pingback: Wk 1 Discussion 515 - Essay Associates
Pingback: Wk 1 Discussion 515 » Termpaperpros
Pingback: Wk 1 Discussion 515 - Gradesmine.com
Pingback: Business & Finance - varsitythesis
Pingback: Business & Finance - uniessaywriters.com
Pingback: Wk 1 Discussion 515 | onlineclassassignments
Pingback: Wk 1 Discussion 515 – brown
Pingback: Wk 1 Discussion 515 - SILENT PAPERS
Pingback: Wk 1 Discussion 515 – SILENT PAPERS
Pingback: Wk 1 Discussion 515 | EssayPrince.net
Pingback: Wk 1 Discussion 515
Pingback: Wk 1 Discussion 515 - EssayHelpUSA.com | EssayHelpUSA.com
Pingback: Wk 1 Discussion 515 -
Pingback: Wk 1 Discussion 515 - MyResearchPaperHelp | MyResearchPaperHelp
Pingback: Wk 1 Discussion 515 - |